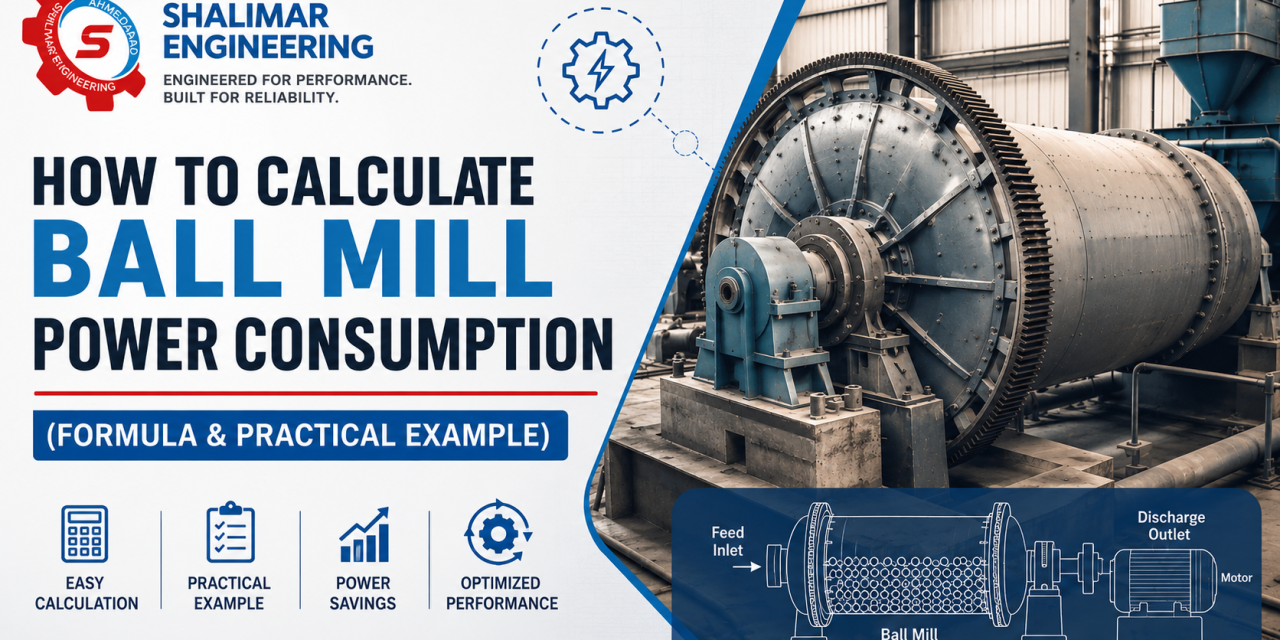
How to Calculate Ball Mill Power Consumption (Formula & Practical Example)
Calculating accurate ball mill power consumption is essential for sizing drive motors, optimizing operational throughput, and preventing costly energy losses in industrial grinding circuits. This comprehensive guide details the practical step-by-step application of Bond’s Work Index formula, complete with empirical efficiency adjustments, practical calculations, and field-tested monitoring strategies to maximize milling performance.
Why Power Consumption Matters in Ball Milling
If you run a grinding operation, even a small miscalculation in motor sizing can cost you thousands in wasted energy or unplanned downtime. Power consumption is not just a number on a nameplate. It directly influences your production cost per tonne, your energy efficiency rating, and the lifespan of your drive system.
Whether you manage a cement plant, a chemical processing unit, or a mineral preparation facility, understanding how much power your grinding mill draws gives you the control to operate at optimal capacity rather than guesswork.
This guide breaks down the exact method used in the industry, including the formula, each variable explained, and a worked example you can replicate right away. If you want to review core equipment designs, check the main ball mill architecture to understand how mechanical components handle variable loads.
What Is Ball Mill Power Consumption?
Ball mill power consumption refers to the amount of electrical energy (measured in kilowatts) required to drive the mill shell, overcome friction, lift the grinding charge, and grind the material to the desired fineness.
It varies based on several operational factors:
-
Mill Dimensions: Shell diameter and length
-
Rotational Speed: Operating speed as a fraction of critical speed
-
Grinding Charge: Mass, volume, and bulk density of grinding media
-
Material Properties: Material hardness, moisture content, and feed size
-
Circuit Design: Whether the mill operates in an open or closed circuit
Calculating power helps you correctly size the drive motor and benchmark actual energy draw against theoretical values during operation.
The Bond Power Formula: Most Widely Used Approach
The most accepted and field-verified method for estimating ball mill power draw is the Bond Work Index Method, developed by Fred C. Bond. It gives power at the mill shaft (also called net power or pinion power).
Bond’s Formula for Ball Mill Power
P = Wi × Q × ( ( 10 / √P80 ) – ( 10 / √F80 ) )
Where:
Bond Work Index & Power Calculation Variables
| Symbol | Definition | Unit |
|---|---|---|
| P | Net power required at the mill shaft | kW |
| Wi | Bond Work Index (grindability of material) | kWh/t |
| Q | Throughput (feed rate) | t/h |
| F80 | 80% passing size of the feed | µm (microns) |
| P80 | 80% passing size of the product | µm (microns) |
This formula calculates the specific energy needed per tonne, then multiplies it by your throughput to determine total shaft power.
Step-by-Step: How to Calculate Ball Mill Power Consumption
Step 1: Gather Input Data
Collect precise process parameters before running calculations:
-
Bond Work Index (Wi): Determined via lab grindability tests or standard reference tables.
-
Feed Size (F80): The sieve size in microns through which 80% of feed material passes.
-
Product Size (P80): The sieve size in microns through which 80% of ground product passes.
-
Throughput (Q): Target production capacity in tonnes per hour (t/h).
Step 2: Calculate Specific Energy Consumption (E)
Specific Energy (E) = Wi × ( ( 10 / √P80 ) – ( 10 / √F80 ) )
This yields the specific energy (kWh/t) required to reduce one tonne of material to the target fineness.
Step 3: Calculate Total Shaft Power (P)
Shaft Power (P) = E × Q
Multiply specific energy (kWh/t) by throughput (t/h) to determine total power required at the shaft in kilowatts (kW).
Step 4: Account for Mechanical and Motor Efficiencies
Shaft power represents net mechanical work. To size the actual electrical motor, account for system losses:
-
Gearbox Efficiency: Typically 0.94 to 0.97
-
Motor Efficiency: Typically 0.92 to 0.96
Motor Input Power = Shaft Power (P) / (Gearbox Efficiency × Motor Efficiency)
For continuous industrial production, proper motor sizing prevents electrical trips and system overloads. Detailed guidance on ball mill motor sizing helps engineers align drive ratings with duty cycles.
Have Questions About Industrial Machinery?
Get in touch with our engineering experts at Shalimar Engineering to discuss your project requirements, technical specs, or site support.
Practical Example: Step-by-Step Walkthrough
Scenario: You are operating an industrial grinding unit to process limestone. Here are your known parameters:
-
Material: Limestone
-
Bond Work Index (Wi): 11.25 kWh/t
-
Feed F80: 12,000 µm (12 mm)
-
Product P80: 75 µm
-
Throughput (Q): 40 t/h
-
Gearbox Efficiency: 0.96
-
Motor Efficiency: 0.94
Step 1: Specific Energy Calculation
E = 11.25 × ( ( 10 / √75 ) – ( 10 / √12000 ) )
E = 11.25 × ( ( 10 / 8.66 ) – ( 10 / 109.54 ) )
E = 11.25 × ( 1.1547 – 0.0913 )
E = 11.25 × 1.0634
E = 11.96 kWh/t
Step 2: Total Shaft Power Calculation
P = 11.96 kWh/t × 40 t/h
P = 478.4 kW
Step 3: Motor Input Power Sizing
Motor Input Power = 478.4 / ( 0.96 × 0.94 )
Motor Input Power = 478.4 / 0.9024
Motor Input Power = 530.2 kW
Motor Selection Advice: For continuous operations, add a service factor of 1.10 to 1.15 to handle start-up torque and feed fluctuations. For this installation, selecting a standard motor rated between 580 kW and 600 kW is recommended.
Rowland Correction Factors for Real-World Accuracy
Base Bond calculations assume standard laboratory conditions. Industrial applications use Rowland & Kjos efficiency factors (EF) to adjust for operational variance:
Efficiency Factors & Condition Corrections
| Factor | Condition Corrected |
|---|---|
| EF1 | Dry grinding vs. wet grinding |
| EF2 | Open circuit vs. closed circuit operations |
| EF3 | Mill diameter scaling (specifically for mills under 3.81 m interior diameter) |
| EF4 | Coarse feed corrections (when F80 exceeds optimal size limits) |
| EF5 | Product fineness adjustments (when P80 is finer than 75 µm) |
When any of these conditions apply, multiply the calculated specific energy by the relevant EF values before computing shaft power. This step is critical for heavy continuous applications like a cement grinding ball mill where strict product fineness requires precise EF5 corrections.
Key Variables That Shift Your Power Draw
Understanding the formula is just part of the picture. Knowing which variables have the biggest impact helps you make smarter operational decisions.
Mill Speed
Mills typically operate between 65% and 78% of critical speed. Running too slow means less impact energy. Running too fast throws the charge centrifugally against the shell without effective grinding. Power draw peaks around 70-75% of critical speed for most charge conditions. Check out the dedicated guide on how to calculate ball mill critical speed for exact rotational formulas.
Charge Volume
The filling ratio of grinding media directly affects power. Most mills run at 30% to 40% charge volume by mill interior. Below 25%, power drops off steeply. Above 45%, you risk overloading the mill and increasing liner and media wear without a proportional gain in throughput.
Grinding Media Size and Type
Larger media imparts more impact force but covers less surface area. Finer grinding applications need smaller media. Choosing the wrong size results in either coarse product or excessive energy consumption. Review the comprehensive grinding media selection guide to match ball sizing with feed hardness.
Feed Moisture
Wet grinding generally consumes less specific energy than dry grinding for the same product fineness. However, feed moisture in dry grinding operations above 3-4% can cause coating on media and liners, sharply increasing power draw without improved fineness.
Power Draw Benchmarks by Mill Type
These are approximate ranges based on industrial practice:
Typical Mill Types & Power Consumption Ranges
| Mill Type | Typical Power Range |
|---|---|
| Small batch laboratory mill | 0.5 to 5 kW |
| Batch ball mill (production) | 5 to 75 kW |
| Sand grinding ball mill | 15 to 150 kW |
| Large continuous cement mill | 500 to 5,000+ kW |
| Ball mill with micronizing plant | 30 to 500 kW |
These figures serve as a sanity check. If your calculated value falls far outside the typical range for your mill type, revisit your input data before proceeding to equipment selection. For instance, smaller production setups like a standard batch ball mill run on significantly lower energy curves compared to continuous circuits.
Advanced Circuit Variations and Energy Curves
Different raw materials require unique grinding dynamics. High-friction materials like silica sand or hard quartz alter ball mill energy consumption profiles.
When configuring dedicated machinery like a sand grinding ball mill, power curves shift due to abrasive sliding friction against internal liners. In contrast, ultrafine powder production using a specialized ball mill with micronizing plant requires significant EF5 Rowland adjustments because fine particles cushion ball impacts.
Understanding your circuit design ensures that your calculated grinding mill power calculation translates smoothly into actual field performance without unexpected motor trips.
Common Mistakes in Ball Mill Power Calculation
Even experienced process engineers make these errors. Avoid them to get reliable results:
-
Using Wi from a wrong source: Bond Work Index varies significantly by ore type, moisture, and grind size range. Always use lab-tested Wi specific to your material and target product size.
-
Ignoring correction factors: Applying the base formula without EF corrections for fine grinding (P80 below 75 µm) or dry milling can underestimate power by 15% to 30%.
-
Forgetting drive losses: Motor input power is always higher than shaft power. Skipping this step leads to undersized motors.
-
Treating F80 and F100 as the same: The Bond method uses the 80% passing size, not the maximum particle size. Using the wrong value throws off the specific energy calculation entirely.
How to Monitor Actual Power Consumption in Operation
Once your mill is running, theoretical calculation must be validated against actual performance. Use these monitoring approaches:
-
Power meter at the motor control panel: Gives gross electrical input. Compare against your calculated motor input power.
-
Specific energy trending: Track kWh per tonne produced. An upward drift signals worn media, oversize feed, or liner damage.
-
Mill sound monitoring: Changes in acoustic signature often precede measurable shifts in power draw and indicate charge level changes.
-
Periodic charge weighing: Mill out the charge and weigh to confirm actual filling ratio against design.
Regular monitoring helps you catch ball mill efficiency drops early, reducing energy costs and maintenance expenses.
When to Consult a Manufacturer
If you are sizing a new mill or scaling up an existing process, calculated values should always be reviewed against specialized sizing tools and field data. Standard formulas work well for typical conditions, but unusual feed characteristics, extreme fineness requirements, or specific circuit configurations sometimes require proprietary correction.
Shalimar Engineering provides detailed technical support for mill sizing, motor selection, and process circuit design for industrial clients across Gujarat and globally. For custom machinery configurations, submit your parameters through the official enquiry form.
You can also visit the main Shalimar Engineering portal to review manufacturing capabilities or reach out via the contact us page for direct engineering assistance.
Summary: Key Takeaways
-
Ball mill power consumption is calculated using the Bond Work Index formula, corrected for real-world efficiency factors.
-
Always calculate shaft power first, then back-calculate motor input power using actual gearbox and motor efficiencies.
-
The three biggest levers on power draw are mill speed, charge filling ratio, and feed-to-product size ratio.
-
Use Rowland EF factors whenever you operate outside standard conditions, especially for fine grinding below 75 µm.
-
Validate your calculated power against actual metered consumption once the mill is commissioned, and track specific energy (kWh/t) as your primary efficiency KPI.
Getting your power calculation right from the start protects your capital investment, ensures correct motor and electrical infrastructure sizing, and gives you a solid baseline for ongoing energy management in your grinding circuit.
Frequently Asked Questions (FAQs)
Q1: What is the main difference between net shaft power and motor input power?
Net shaft power is the mechanical power required to turn the mill shell and grind material. Motor input power is the electrical power drawn from the main grid, which accounts for mechanical losses in the gearbox and electrical motor efficiency.
Q2: Why does dry grinding require more power than wet grinding?
Dry grinding consumes about 1.3 times more specific energy (EF1 factor) than wet grinding because dry particles cushion impacts and lack fluid suspension, creating higher internal friction between media and liners.
Q3: How does critical speed impact ball mill power draw?
Operating speed dictates media movement. Below 60% critical speed, balls slide without grinding action. Beyond 80%, media centrifuges against the shell without dropping. Optimal power draw occurs around 70-75% of critical speed.
Q4: How do I choose the correct motor rating based on calculated power?
Always add a service factor (safety margin) of 10% to 15% to your calculated motor input power to safely absorb start-up torque surges, feed rate fluctuations, and hardness variations.
Q5: Why is my actual mill power draw higher than the theoretical Bond calculation?
Discrepancies usually arise when Rowland efficiency factors (EF) are omitted for dry milling or fine grinding (P80 < 75 µm), or due to excessive feed moisture (>3%), overfilled ball charge (>45%), or severely worn liners.